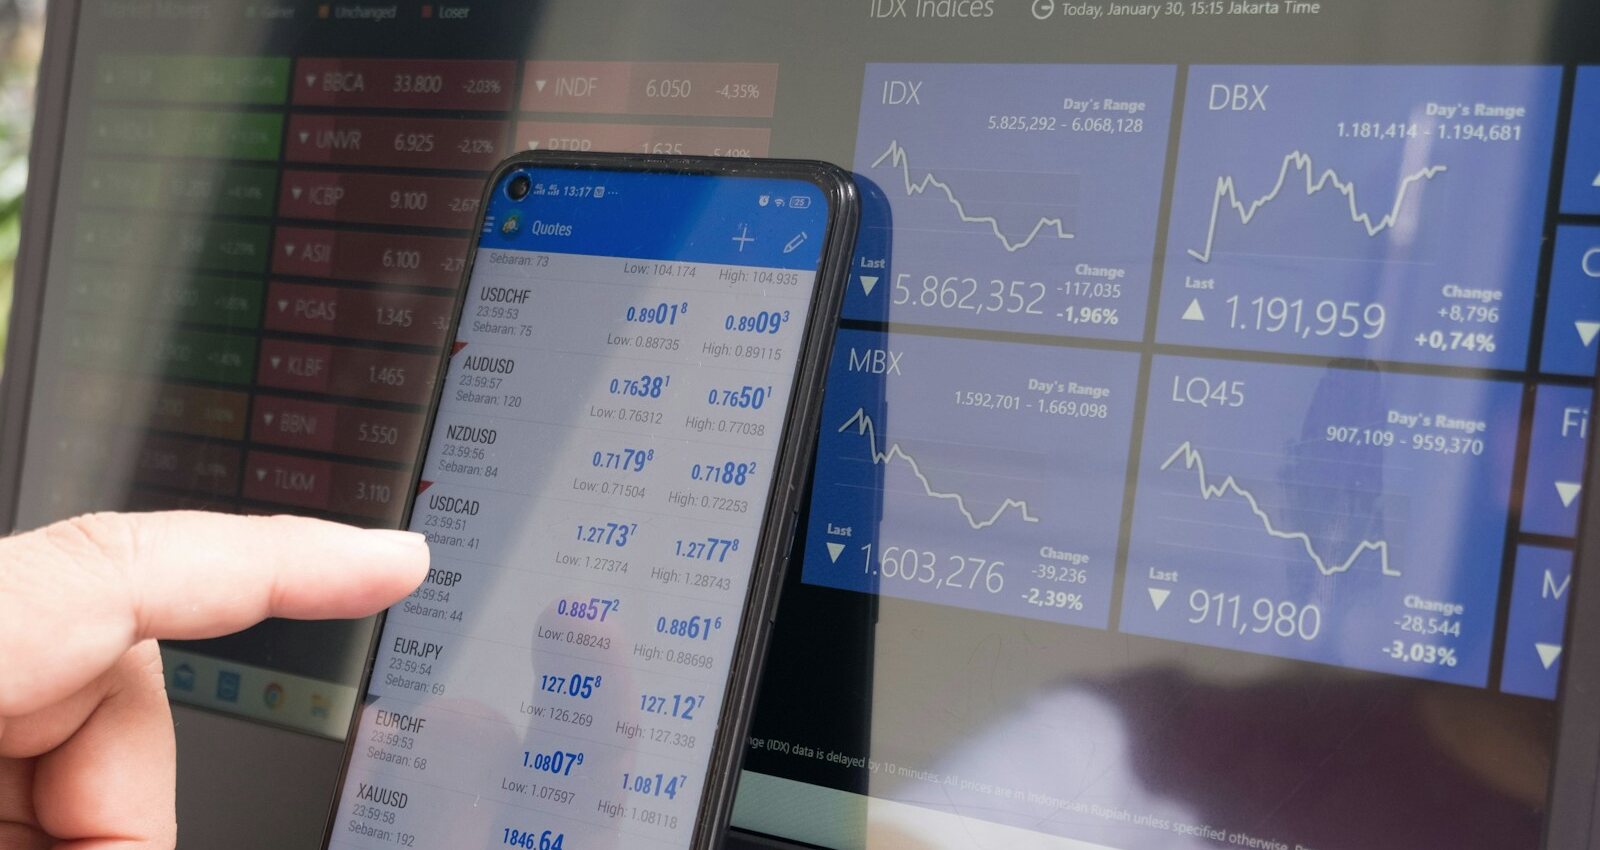
Transaction activity offers a timely view of household behaviour, but the signal is easy to overstate. A rise in spending can reflect higher prices, changing payment habits or pressure on household finances as readily as stronger real demand. Reading the pattern well requires context from incomes, savings, credit and the uneven circumstances that aggregate totals conceal.
A fast signal can carry several stories
Payment activity can appear sooner than many conventional economic measures and can reveal turning points in particular categories. Yet transaction values are usually nominal: more money spent may reflect higher prices rather than a larger quantity of goods and services. Separating price, volume and product mix is essential before interpreting a change as stronger or weaker demand.
Timing creates further ambiguity. Holidays, weather, billing cycles and one-off purchases can shift spending between periods, while a move from cash to cards can increase recorded activity without changing total consumption. Category definitions may also lag new business models, so apparent growth can partly reflect where a transaction is classified rather than what a household consumed.
The balance sheet sits behind the purchase
The same level of spending can rest on very different foundations. It may be funded from rising income, accumulated savings, asset sales or additional borrowing, each of which has different implications for persistence and financial resilience. Transaction data alone rarely identifies the source, so strength at the checkout should not be treated as a complete account of household health.
Credit can smooth a temporary mismatch between income and expenditure, but it can also postpone adjustment when essential costs rise. Interest burdens, repayment schedules and access to new credit shape how long that bridge remains available. Examining spending alongside savings behaviour, arrears and debt service helps distinguish capacity from the continued willingness or necessity to transact.
“Spending data records a transaction, not the household trade-off that made the transaction necessary or possible.”
Aggregates hide uneven experiences
A broad spending total combines households with different incomes, housing costs, debt, assets and exposure to inflation. Higher-income households may account for a large share of discretionary value, while lower-income households may devote more of each additional unit of income to essentials. A stable aggregate can therefore coexist with substantial pressure or flexibility beneath the surface.
Data coverage can reinforce that blind spot. A panel may overrepresent certain payment methods, regions or customer groups, and changes in membership can resemble changes in behaviour. Cohort analysis and consistent samples can clarify the pattern, but they still require care around privacy, representativeness and the difference between observed customers and the wider population.
Build context rather than a verdict
Spending becomes more informative when considered with wages, employment, consumer prices, credit conditions and household expectations. These measures move on different schedules and answer different questions, so disagreement among them is not necessarily an error. It can identify the transition between an income shock, a financing response and an eventual change in consumption.
The practical value of a spending signal lies in the questions it sharpens. Which categories changed, was the movement driven by price or volume, who appears to be changing behaviour and how was the purchase funded? Treating the data as one layer in a wider household-finance picture preserves its timeliness without asking it to reveal motives and resilience that no transaction record can show.